

Do you remember that childhood game telephone?
The one where a whispered message circles a room, passed on player to player, and by the time it reaches the last person it has often transformed into something hilariously different.
The process is simple yet profound: as information passes through the multiple ‘media’ of human voices, expressions, and memories - it mutates, drifts, and sometimes even forms entirely new meanings.
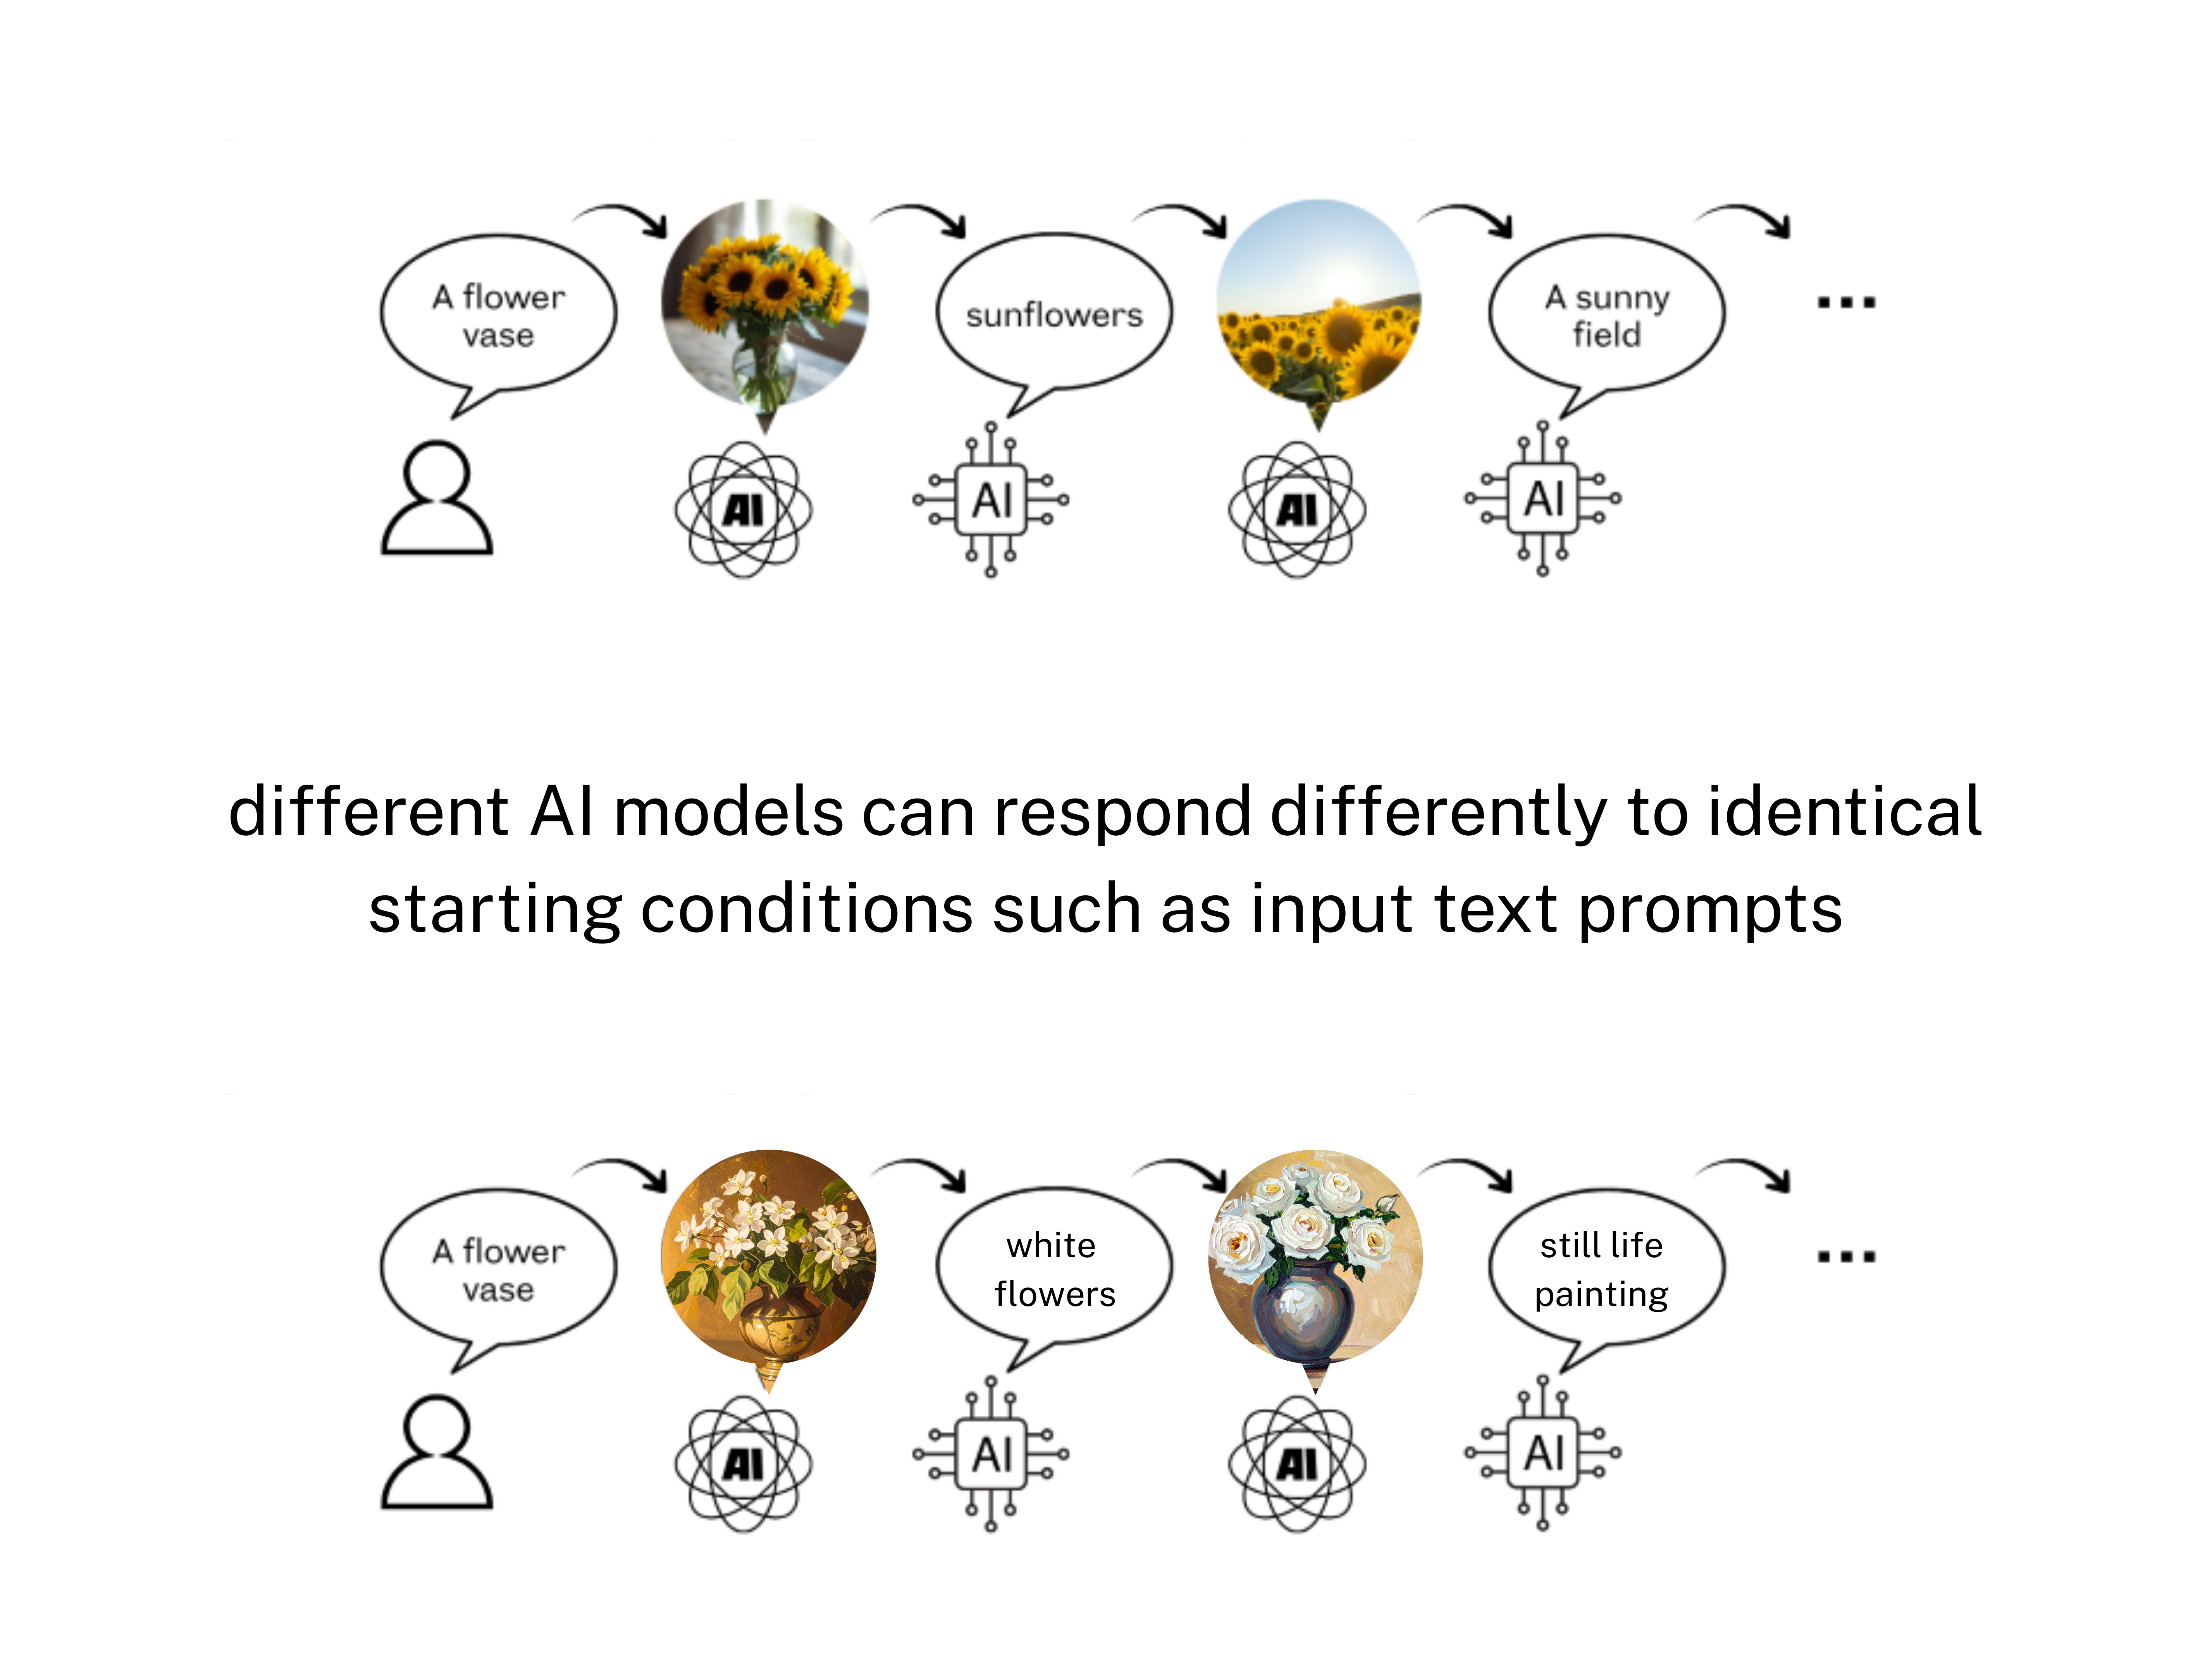
This same idea of ‘drift’ in a message can be taken into the world of artificial intelligence (AI). Instead of children passing along a message, imagine a network of generative AI models, each transforming information from form to form - text to image, image back to text, and on and on. This is the core concept behind PANIC (Playground AI Network Interactive Creativity), our experimental multimodal AI system.
In PANIC, each output is fed back in as the next input, creating an iterative loop, generating sequences of evolving images and texts. Just like in the game of telephone, we observe semantic drift: meanings shift, details morph, and surprising new patterns emerge.
And here’s the intriguing question: amid the apparent chaos, is there hidden structure?
Can we identify patterns in how AI ‘conversations’ evolve? And if so, how might we measure them?
What is Topological Data Analysis?
To tackle these questions, we turn to topological data analysis (TDA), a mathematical framework designed to uncover the shape of complex data. Unlike traditional statistics, which might summarise information using averages or variance, TDA examines the shape (or geometry) of data itself - clusters, loops, voids, etc. We use TDA to reveal how points relate to each other in space.
TDA emerged in the early 2000s at the intersection of mathematics and data science, bringing tools from algebraic topology into the study of complex data. Its foundational idea is that “shape matters”. TDA shows that the arrangement and connectivity of data points often reveal more than their absolute positions – aka the relationships between pieces of information have more meaning than their placement.
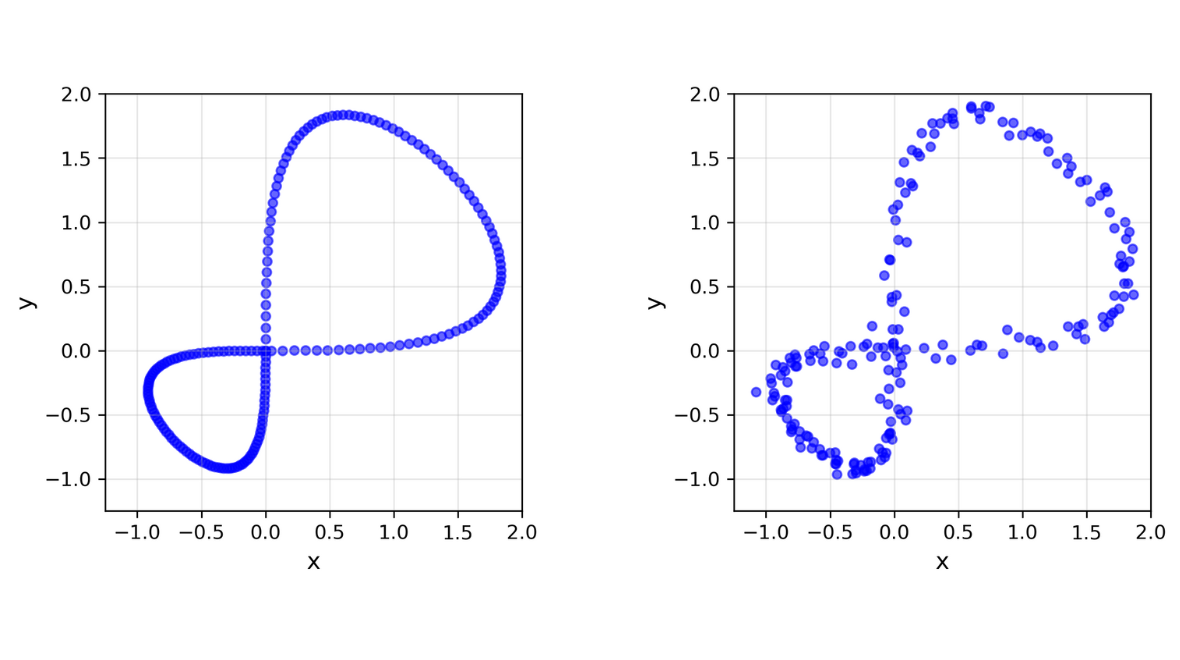
Let’s have a look at two similar-looking point cloud data in Figure 1. We can that whilst both look like a figure-eight, the left one is “perfect” while the right one is slightly deformed - hence a “noisy” figure-eight. When our data comes from the real world, it’s likely to be noisy which can make analysis trickier. This is where TDA comes in. TDA can be a powerful tool and method as it has a robustness to noise – allowing analysis to take place undisturbed.
One of the central tools we use for TDA is persistent homology, which tracks topological features across multiple scales. Think of persistent homology like exploring a landscape from both afar and up close: landscape features of valleys, ridges, and lakes appear and disappear depending on your vantage point. Persistent homology captures which features persist through all vantage points, offering insights to the underlying structure that survives disturbance such as noise and transformations.
TDA has been applied in diverse fields, including neuroscience, genomics, and climate modeling. It is used as an effective tool to understand complex, noisy, and sometimes high-dimensional data in terms of shape, not just numbers.
TDA’s application even extends to the evolving representations in a network of generative AI models – which is what we’re interested in.
Mapping PANIC’s Information Flow
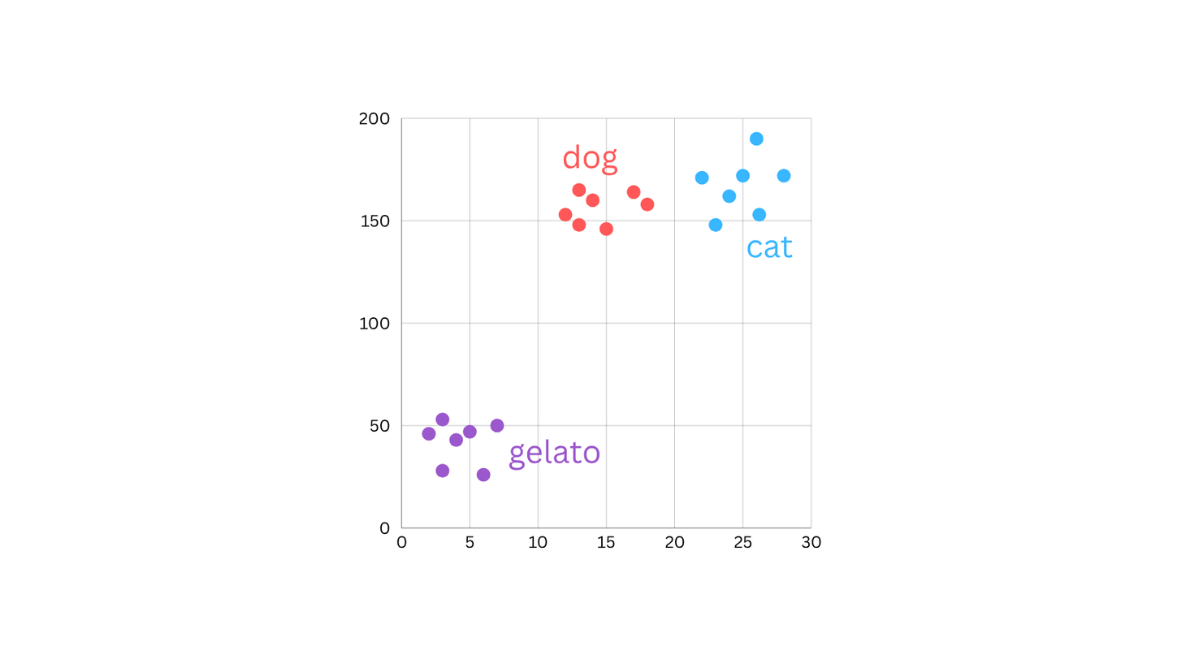
In our experiments with PANIC, each output (AI-generated image or text caption) is represented as a vector (also known as an embedding) in a high-dimensional space. These embeddings map semantic information (meaning) onto a coordinate system (like the xy-plane in Figure 1). This mapping reflects the relationship between different objects, where outputs that are similar sit closer together, while more dissimilar outputs are further apart. Each embedding encodes information about semantic objects, for example, whether they can move, have fur, change their shapes according to temperature, etc.
To better understand the meaning of our outputs from PANIC, we apply persistent homology. As PANIC cycles outputs through its generative models, vectors trace the trajectories of these outputs in high-dimensional space. By computing persistent homology, we can detect and quantify topological structures in these trajectories. This lets us better understand the trajectories of PANIC’s outputs and helps us answer questions about themes, relationships, stable patterns, and sensitivity.
Some questions our research asks are:
-
Do we see loops indicating recurrent themes?
-
Do clusters represent stable semantic attractors, where the outputs approach the same content over time regardless of initial conditions (set by different input text prompts)?
-
Or, is the trajectory of outputs largely chaotic, with features appearing and disappearing rapidly?
-
How sensitive is the trajectory to initial conditions? Does a slight change in the initial condition result in a huge difference in the trajectory of outputs? Or, the change does not impact the outcome too much?
-
Which parts of the system have the biggest impact on what happens? Initial conditions? Types of GenAI models? Or, network configuration?
Insights from PANIC (thanks to Persistent Homology)
Already in these early analyses, we see fascinating patterns.
Sometimes PANIC produces outputs that cluster tightly in semantic space, these repeated themes suggest the existence of more preferred (or repeated) themes associated to certain generative AI (genAI) models used by PANIC.
Because we built PANIC to be compatible with many different genAI models, we can see that when we change PANIC’s configuration through replacing the internal genAI models, we can see the differences between these models. Many of these information passing processes would be too complex to visualise without persistent homology, which allows us to understand that the differences between these models indicates the exploration and diversity of semantics given to semantic objects by these different genAI systems.
Remember that game telephone and how it is a lot like generative AI models?#
Just like you want to know how the message became distorted in the game (and who is responsible), we want to know how information flows in genAI models (and where the surprises came from).
The number of surprises or degree of uncertainty we can measure in the information flow tells us about the measure of entropy in these systems.
In a nutshell, entropy is the idea that randomness, or degree of order, in a system can be measured (and is inevitable).
In some cases, the distribution of persistence entropy, which is a measure of the spread or concentration of topological features, shows bimodality. This bimodality implies that the system oscillates between two distinct dynamic regimes: one that is ordered with attractor-like states and the other a more chaotic, exploratory state, jumping between clusters of different semantic objects.
Our findings hint at a deeper principle: even in systems that first appear unpredictable, the dynamics of generative AI are not entirely random. There is an underlying topological fingerprint, which may be unique to each network, reflecting how information is transformed, preserved, and occasionally lost as it flows.
Why This Matters
Understanding these patterns is more than a mathematical curiosity.
As AI systems become increasingly embedded in creative, social, and communicative applications, it becomes crucial to comprehend how information evolves across these systems. Topological data analysis (TDA) provides a lens to see beyond surface outputs and examine the structural dynamics of AI-mediated information flow.
By treating generative AI networks like “complex telephone games,” and applying tools like persistent homology, we can begin to map the contours of meaning as it shifts and drifts. This opens exciting possibilities for designing more stable AI systems, exploring emergent creativity, and even predicting how AI networks might behave in novel situations involving different modalities, whether it be text, image, sound, or who knows – even smell in the future!
In short, while PANIC may appear playful, it also offers a rich laboratory for studying the shape of information itself. And that’s exactly how we use it.
Through topological data analysis, not only can we start to see the hidden patterns that underline the apparent chaos of generative AI outputs, but we can also deepen our understanding of such high-dimensional complex features with quantitative measures like entropy.
This leads to some deeper philosophical questions like:
- How can we better understand the “inner mind” of genAI tools?
- What kind of insights can we gain to better and more safely use genAI tools in the aspects of hallucinations, regulations, agency, etc. ?
We’re here with you, making sense of chaos in technology so we can all understand, steer, and use it better – so don’t panic!
This is based on the joint work between Sungyeon Hong and Ben Swift, presented in the IEEE International Conference on Systems, Man, and Cybernetics 2025 in Vienna, Austria.